top of page
PowerPoint Diagrams
With the Power-user for PowerPoint add-in, you can create diagrams directly into your presentation.
These diagrams are powerful tools to make a visual impact when building presentations, dashboards or infographics.
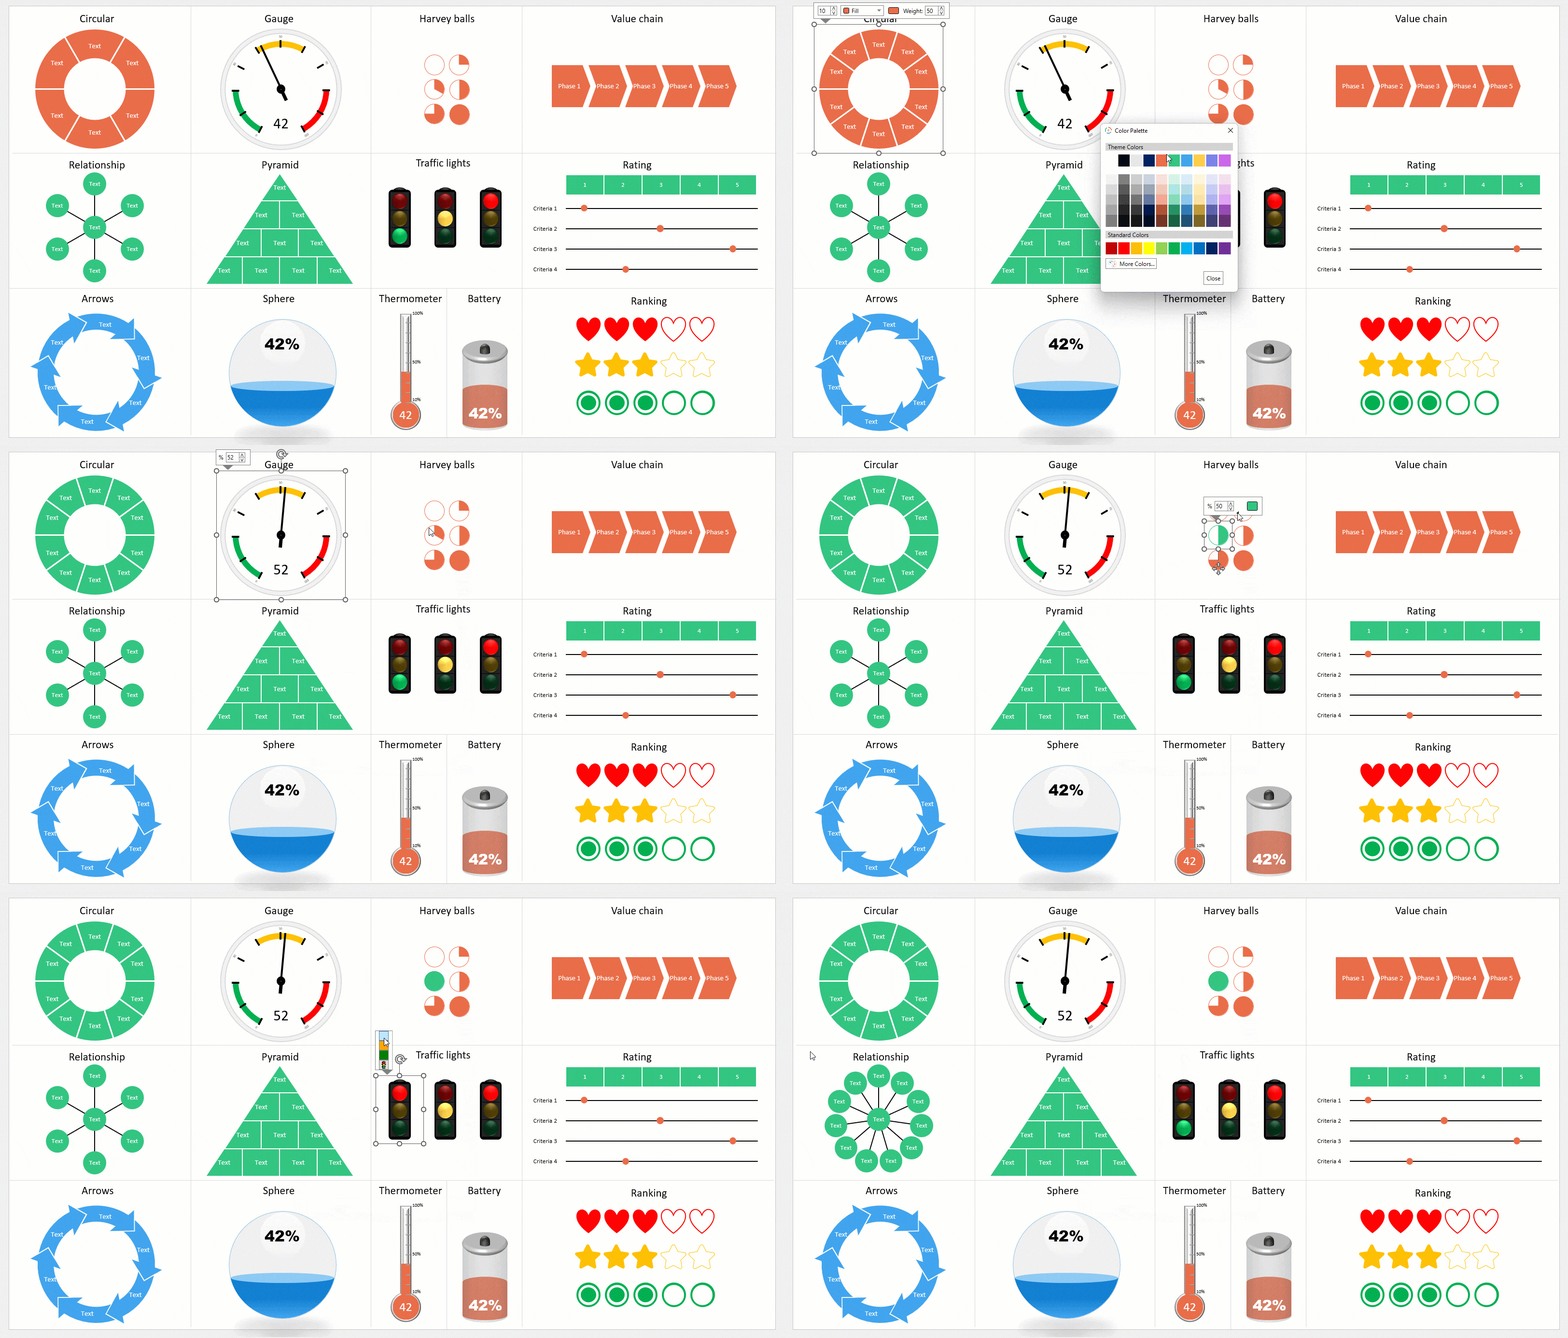
Our diagrams generator can create 13 different types of diagrams:
-
gauges,
-
traffic lights,
-
ranking diagrams,
-
thermometer diagrams,
-
value chains,
-
relationship diagrams,
-
arrows diagrams,
-
rating diagrams,
-
Harvey balls diagrams,
-
pyramid diagrams,
-
circular diagrams
-
sphere diagrams,
-
battery diagrams.
For each diagram, you can parameter it to make it exactly the way you need. For instance, you can build a relationship diagram with the number of outer circles you want.

Most of the diagrams are also made of smart, dynamic shapes, allowing you to edit them on the go. For instance, change where the needle of a Gauge diagram points by just changing its value. Adjust the color of a traffic light for a project status report. Increase or decrease the number of stars to rate a product feature or an experience. Or change the value of a Harvey ball dynamically to illustrate orders of magnitude.
This dynamic behavior can make your life easier since you don't need to re-create or manually edit these objects with every new update.
bottom of page
